Departmental Course Evaluations
The "New" ISAT Course Evals
All course eval data can be downloaded from the appendix.
The foundational premise of the new SIS student evaluation of teaching instrument as described in a presentation I gave to the department in August 2017 is as follows:
The data from student evaluations of teaching are designed to be used by the instructor in the construction of a narrative, whether for annual evaluation, or during preparation of an application for promotion and/or tenure that speaks to the quality of instruction as it is evolving over time.
After my first semester of data, here was my analysis. Please take these analyses with a grain of salt since this is still a VERY new instrument:
Most of the histograms looked the same. If a histogram stood out as starkly different from others, I flagged that one for more scrutiny, both within and between courses. For example, on question #6 ("Understood how each topic fit into the course"), in one class 12 out of 13 responded Frequently/Always, whereas in another only 11 out of 18 gave it the same rating. This suggests I'm doing much better at contextualizing the content in the first course compared to the second.
On the other hand, for question #8 ("Found ways to apply the course content in a meaningful way"), 16 out of 18 responded Frequently/Always in the second course compared to only 9 out of 13 in the first. Taken together, I could say that in the first course, students typically knew how the topics fit into the grand scheme even if they didn't always have a way to apply the knowledge. In the second course, students immediately saw the practical applicability of the individual topics but weren't quite as sure how all of the topics fit together.
As it turns out, the first course was ISAT 340 (software development) and populated more by juniors, and the second course was ISAT 345 (software engineering) and had more seniors. ISAT 340 is much more "structured" in that students are being guided through the steps of developing software, so it's reasonable that they understand how the steps all fit together, even if they don't have any immediate practical use for those steps. In contrast, the 345 students are in a situation where they're being shown the principles of agile software development process, but they have to figure out for themselves how to apply it to a very specific problem. Therefore, they see things as more practical, but can't yet see the big picture. The seniors are also usually in the middle of interviewing for jobs and see the 345 content as practical because they are being asked about it in interviews.
Although rare, I treated "Hardly Ever" ratings as red flags that indicated areas I should watch out for in the future. For example, in 340, I had one or two students who reported "Hardly Ever" for questions 2, 3, 6, and 9. Taken together, that suggests a student who was not very engaged with the course. I checked the CSV to see if the ratings belonged all to a single person; turns out they did not, and so the "dissatisfaction" was more diffuse and spread out, and perhaps less attributable to something thematic that I might want to tackle. If all of the negative ratings had been associated with a particular person, I might try to reflect on how I might better have been able to reach that student.
The Control/Motivation questions showed that even though most people didn't have a choice about whether or not to take the class (#5), they expected that they would do well (#1) and ended up highly valuing the material (#6). Assuming they were honest, they spent only about half of the time outside of class that I hoped they would (#7). There was some dissatisfaction with how prepared they felt (#4), which is partly my fault since I teach the pre-requisites to both of these classes.
The open-ended feedback added more color to the above analyses. Given the above analyses as measured over a number of years, I believe that I could construct a convincing narrative that I have been a diligent and conscientious instructor. I believe that comparing values across courses had great value, and it might even be better if I had, say, departmental data as a comparison.
Given the above analyses, I think I could be a bit more conscientious about making sure students understand how topics fit together, or, barring that, support them as they work to figure out how to construct their own puzzle. I could also do more to help students discover the relevance and value of the content.
After looking at my Spring 2018 responses for ISAT 252, it appears that students are still struggling to be disciplined enough to work on assignments diligently throughout the semester rather than putting everything off until the last minute. I think the struggle for me is finding the appropriate balance between relaxed and laid back and scary and threatening. Some students would clearly prefer if I put a bit more pressure on them to perform.
I was flattered that one student said: "Morgan is the best professor at JMU." (ISAT 252--Spring 2018--Section 2)
The "Old" ISAT Course Evals
All course eval data can be downloaded from the appendix.
Key points in this section:
- The overall mean (2011-2016) is 4.13 out of 5
- 80% of my ratings were either a 4 or 5
- Highest scores: #6 (concern and respect), #9 (fair and impartial), #5 (answers questions), #8 (helps outside class)
- Lowest scores: #14 (value of homework), #10 (timely feedback)
- Student evaluations are consistently normally distributed (not bimodal)
Overall Scores By Year, Semester, and Course
The chart below shows the cumulative frequency of students' responses on my course evaluations across all of my courses from 2011-2016. The "a5" bar represents the "strongly agree" response category, which is the most positive, while "e1" is the most negative response. The actual numbers are, from left to right, 46%, 33%, 15%, 5%, 1%. In short, the overwhelming response to my teaching has been positive (79%) with 94% being at worst neutral. Only 6% of responses were negative.

The next two charts demonstrate that the overall response pattern has remained consistent from year to year. (NOTE: Shorter bars in the charts below does NOT mean lower scores. It only means there were fewer responses, since the bars represent the absolute frequency of responses in any particular category. The key thing to focus on is the distribution of scores.)


Likewise, there is a similar pattern semester to semester.
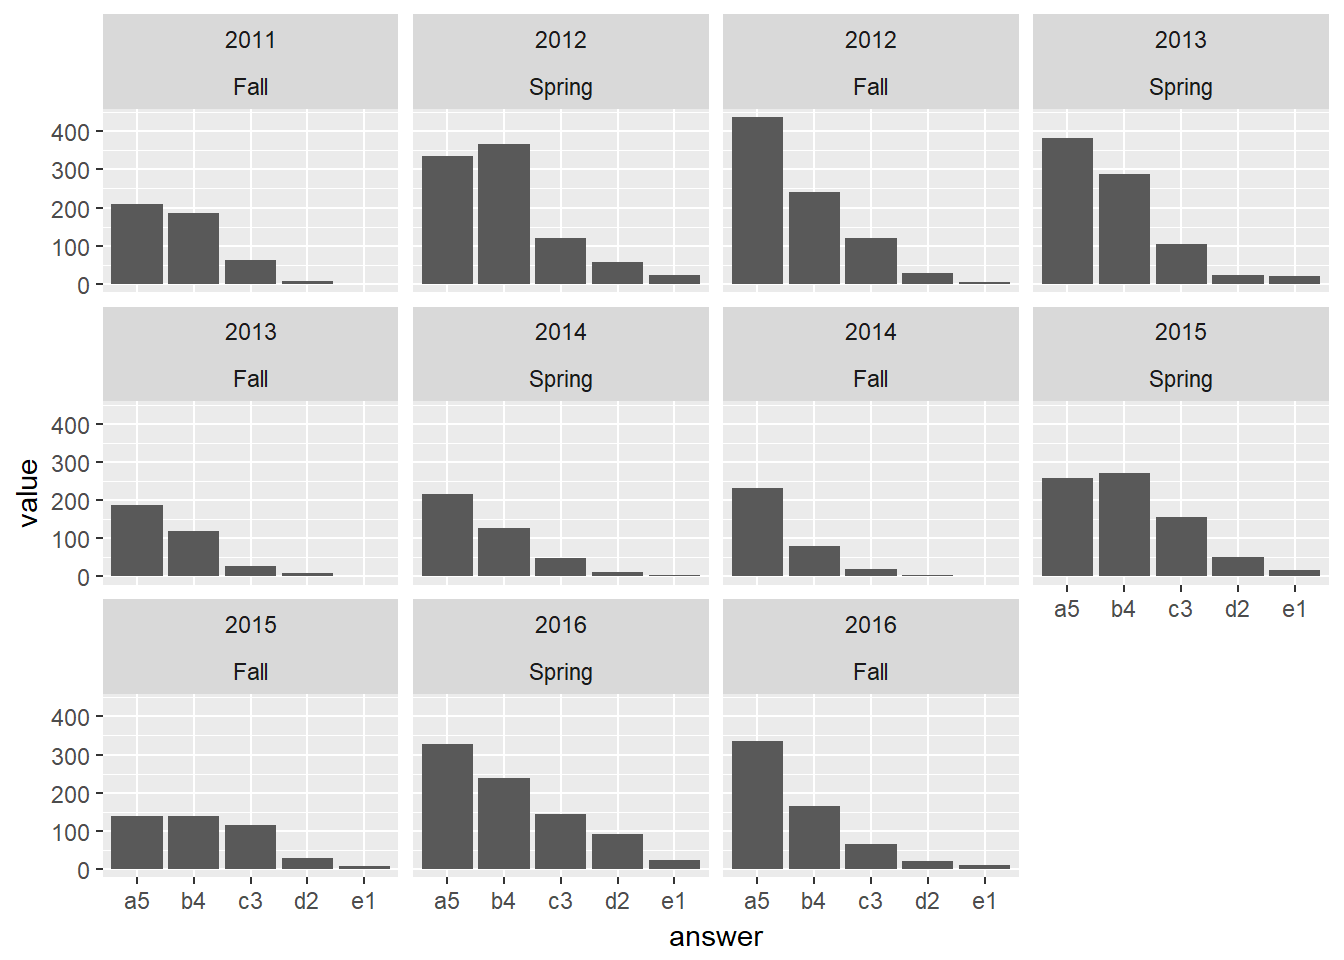
The outlier in the above charts is the Fall 2015 semester. The straightforward explanation for the more uniform distribution of responses in this semester was a dramatic shift in how I began to conduct assessment in my classes. In the Fall 2015 semester, I switched from the choose-your-own-grade pedagogy that I had used from Fall 2011 to Spring 2015, and began using the points-accumulation strategy that I have employed since then. The story behind this change is told in my teaching narrative.
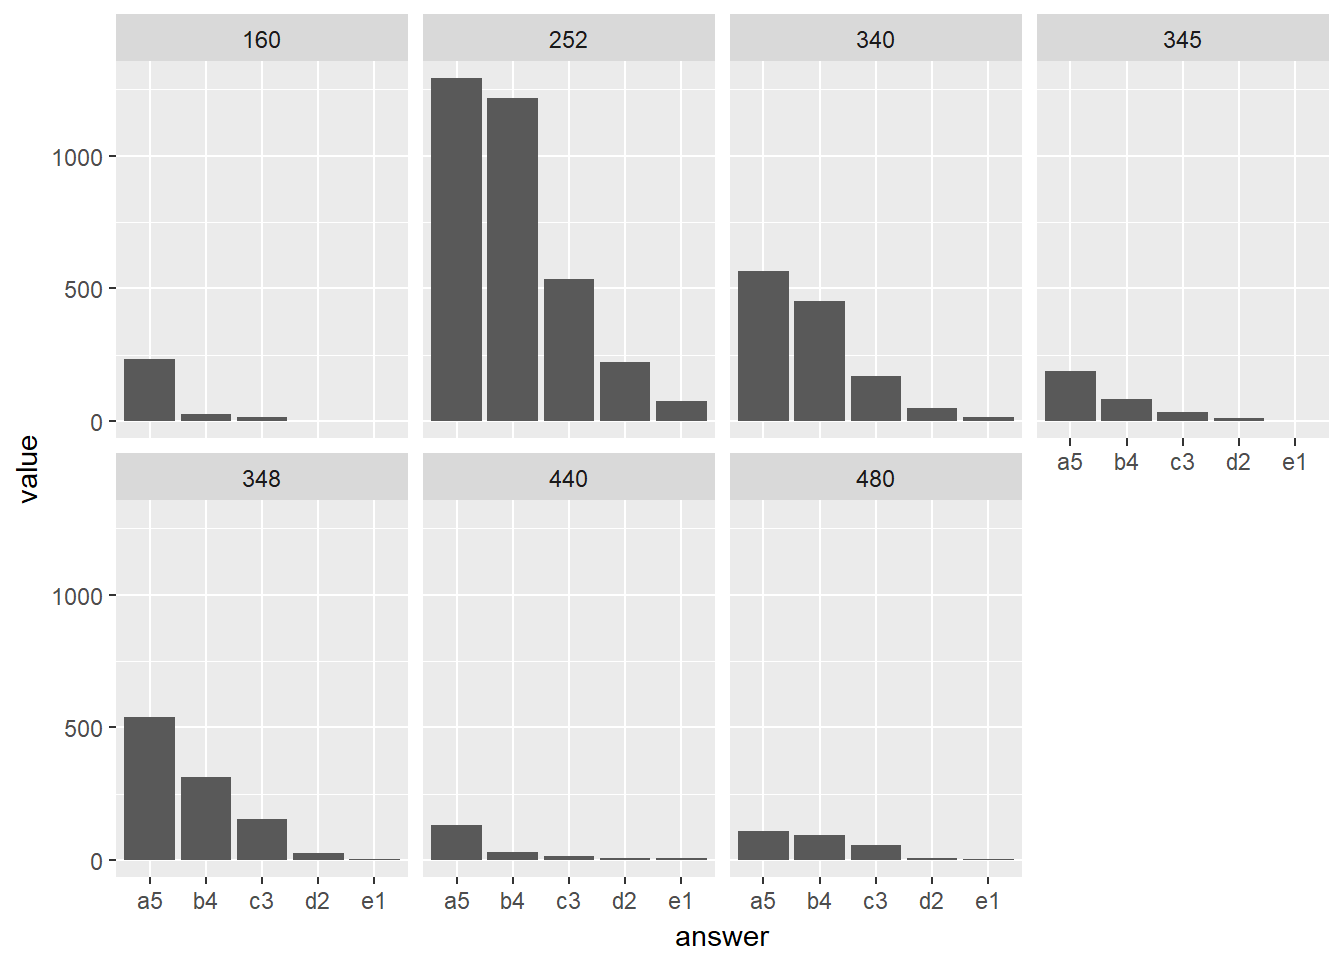
The normal distribution of student responses showing an overwhelmingly positive response to my teaching holds when scores are looked at by course. Again, the bars in the chart below represent absolute frequencies, so the high bars for ISAT 252 just indicates that I've had A LOT more 252 students over the years than any other course.
Overall Scores By Question
While the response patterns across the whole instrument described above tell a general story about students' positive evaluation of my courses, there is probably more value to be gained by looking at the response patterns on a question-by-question basis. Note, that I seldom, if ever, use a textbook or give traditional exams in my courses, so I have not reported on the scores for questions #13 and #15 which address those aspects of a course. The first chart in this section shows the overall response patterns for each question over the entire time period 2011-2016.
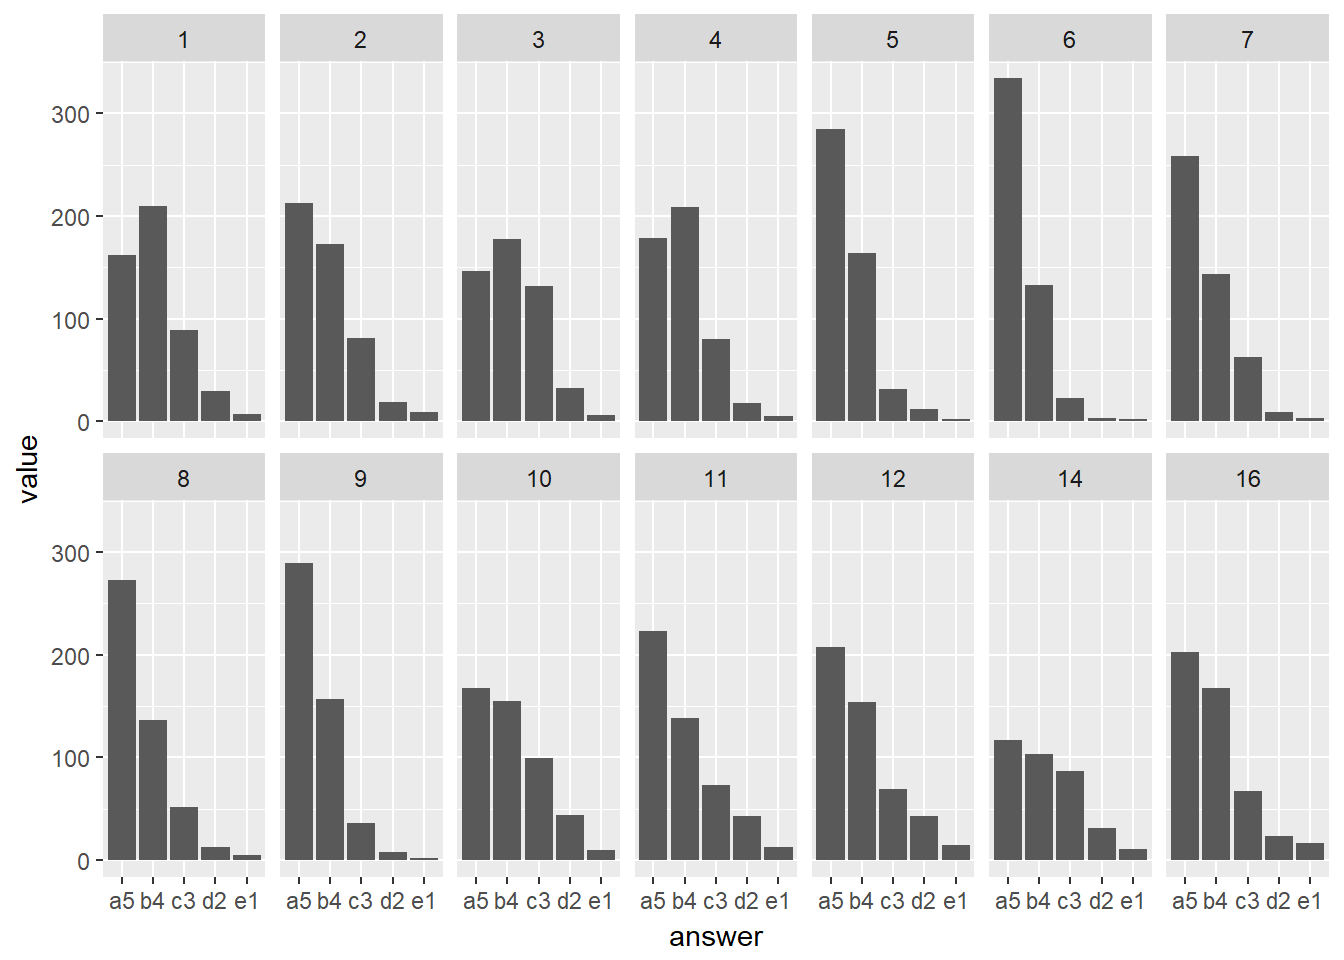
Clearly, the most positive response is to question #6 (The instructor shows concern and respect towards students). Nearly tied for second most positive are questions #9 (The instructor is fair and impartial) and #5 (The instructor acknowledges all questions insofar as possible). Almost as high as these is #8 (The instructor is effective in helping students outside of class). All together, these four questions tell a story that I'm extremely proud of. I absolutely want to be known as a professor who is kind, respectful, helpful, fair, and a good listener.
This desire is not just vanity. Self-Determination Theory (SDT) is a psychological theory of motivation that holds that intrinsic motivation (which has been demonstrated to be far superior to extrinsic motivation in fostering deep learning) is associated with:
- Autonomy--choice over what you do, when you do it, and how you are evaluated for it
- Relatedness--a sense of kinship both to people (instructor, classmates) and to the content
- Competence--a feeling of mastery which can apply to small nuggets as well as broad content areas
I intentionally build a sense of relatedness with my students by being kind, available, open, helpful, and non-judgmental. I communicate respect for students by giving them autonomy over how they spend their time in my courses (within specified boundaries), letting them know that I trust them to spend their time wisely. I've been working for years to develop pedagogy that maximizes the opportunity for students to chart their own course without blowing through the guardrails.
The two questions with the lowest responses are #10 (The instructor gives timely feedback on student peformance) and #14 (Homework is a valuable tool for learning the course material). There is a good reason why these questions have the lowest scores, but first let's look at two other representations of the per-question data to help get some more insight:
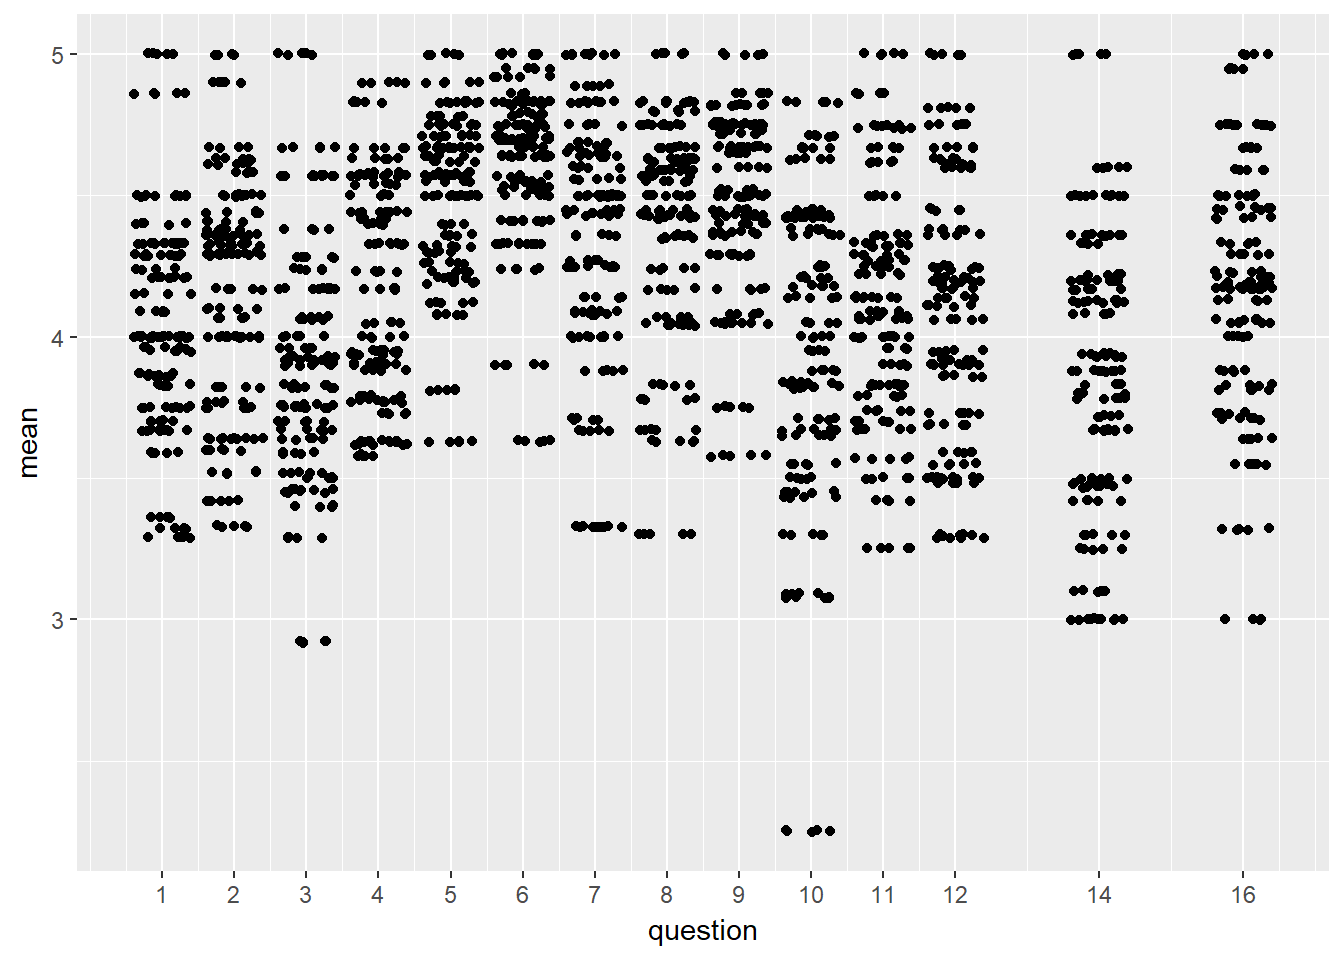

In the first chart above, each dot represents a single student response. The vertical location represents the mean response value for all responses on that question for that course. Since there are roughly 500 responses per question, a small amount of noise, or "jitter," has been added so that information is not hidden by overlapping dots. Note that the vertical axis does not start at zero, so the "low" values are not as low as they appear. The second chart above shows the box plot for each question. The heavy horizontal line in the middle of the box represents the median (50th percentile). The top and bottom of the box represents the 1st and 3rd quartiles (25th and 75th percentiles). The thin lines extending from the top and bottom of the box represents the minimum and maximum (0th an 100th percentiles). Any dots represent outliers, which are greater than 1.5 times inter-quartile range away from the median.
As you can see from these representations, even for my "low" scoring questions (#10 and #14), the median scores are at or near 4 out of 5 on the scale, and in all cases the minimums are above a mean of 3. #10 is pulled down by one particularly low outlier. As it turns out, the outlying scores on question #10 come from Fall 2015 and Spring 2016. These were in the two semesters after I switched away from CYOG and to my new points-accumulation strategy and I was still figuring out how to do it effectively. By Fall 2016, these scores were beginning to return to be more in line with the rest of the scores.
Addressing the Written Feedback
While the written comments on the departmental evaluation forms were not anywhere near as informative as the 3-5 page exit essays I received from each student, I still read them and attempted to respond to them with updates to my pedagogy in successive semesters. Let's start with the number one comment that I got.
#1 "There needs to be more structure!!!"
Put nicely, students provided comments such as:
Benton is an awesome guy and I like the theory behind the way the class is setup, but I feel like I would get more out of the class if there was more structure. (ISAT 252--Spring 2013--Section 2)
Put less nicely:
It's incredibly easy useless class. [sic] Professor brings no value to education. Terrible representation of the ISAT major. (ISAT 440--Spring 2016--Section 1)
A number of students suggested (both in writing, and during our face-to-face interviews) that there should be more "structure" to the class. This puzzled me because I had very detailed syllabi, and in most semesters, each student was required to complete a personalized, weekly survey in which they laid out their plans and goals for the week and evaluated how well they had done on the previous week.
Eventually what I discovered is that by "structure," students were asking for due dates. They found that when given the freedom to work on tasks of their own choosing at their own pace, they did not have enough discipline to make wise use of their time. In more recent semesters, I've found a couple of strategies for addressing this issue.
The first strategy for getting students to be more disciplined about using their time is to force them to make regular presentations to the class. These are typically very short (3-5 minutes each), but since each student has to get up in front of the class and explain what they've been doing and why it was worth spending their time on, the fear of appearing lazy or like a "slacker" keeps them productive. If kept short, presentations only consume 1-2 class meetings every 3 weeks or so.
The second strategy is to put a cap on the number of points a student can earn in a week. I was finding that with my new points-accumulation strategy, students were putting off working on their badges until the end of the semester. They would be industrious for the first 4-6 weeks of the semester, then plateau, then scramble in the last 1-2 weeks to make up for lost time. Not only was this not fun for anyone, but it also resulted in poorer work, poorer learning, and poorer outcomes. By telling students up front that they cannot earn more than 15 points in a week, it forces them to spread their point earning out over more weeks of the semester. I've only had one semester in which to pilot this strategy, and so far the results seem promising.
In short, with the new badges/points-accumulation system (see my teaching narrative for a description), coupled with regular class presentations and a weekly cap on points, students feel like they have enough "structure" to keep them motivated to perform consistently throughout the semester. At the same time, I'm still able to preserve enough autonomy so that student passion can get a foothold. It's a difficult balance to achieve and I'm still working to fine tune it.
#2 "More timely feedback, please!"
Put nicely:
Great course! I learned a lot in not very much time. I feel like the grading scale is off. I spent more time on each assignment than was anticipated by the professor. (e.g. 20 hours on mid-level CSS, rather than 10...) Timely feedback would benefit the class :)
One of the downsides of letting each student choose to work on whatever course-related thing they would like to is that it makes providing rich feedback more of a challenge. Since I didn't have everyone turning in a similar assignment on the same day, I didn't have nice orderly stacks of tests or quizzes or essays that I could take home and mark. Instead, I would get different kinds of work at different intervals from many students. From some students I would get almost nothing at all. It was difficult to keep track of all of it.
One of the nice things about computer programming is that it's relatively easy even for a total beginner to know whether or not their program works. As such, a lot of the feedback is immediate and very clear. That being said, when students get stuck on a program, getting unstuck can take quite a while. I've been getting better at training them to know when they've been stuck "too long" and that they should come talk to me.
On the other hand, perhaps more than any other field, computing requires professionals to be self-taught. The half-life of your average programming technology is only 18 months to 2 years. If a person can't develop the ability to teach themselves a new language or framework, then this is probably not a field that they would enjoy. Knowlege is extremely volatile. I am now teaching courses on things like mobile apps and progressive web apps that really didn't exist when I graduated from grad school 10 years ago!
In summary, there are definitely times when student have been right to complain that they need more timely feedback from me. Other times, I haven't been doing a good job at setting expectations about when and how they should be more self-directed than in other classes. This kind of comment has been getting less frequent in more recent semesters as I've created more streamlined processes for being notified about when there are assignments waiting for feedback.
Summary
As the SET Task Force established with the department, in the context of evaluation of a faculty member, when looking at students' course evaluations, the AUH/PAC should seek to answer the following questions:
- Is there evidence that the instructor is paying attention to feedback from students?
- How did the instructor respond to negative feedback? What adjustments did they make?
- If negative evaluations persist despite instructor efforts, taking into account all other evidence for teaching quality, does this merit a lower evaluation?
I believe that my teaching narrative tells a rich story about my responsiveness as an instructor. Not only have I paid attention to the feedback from students in the departmental course evaluations, but I have gone over and above to collect a great deal more feedback from students in the form of:
- End-of-Semester Interviews (of which I've conducted over 700)
- 3-5 page Exit Essays (of which over 1000 pages are included in this portfolio)
- TAP analyses conducted by CFI
The departmental evaluations described above tell the story of an excellent instructor. They tell the story of an insructor who receives consistently high ratings despite the fact that he is making dramatic changes to the ways in which students experience courses. They also tell the story of an instructor who is human and has ups and downs over the years. I believe my responses to student feedback are exemplary and a testament to the high standards that ISAT maintains for our interactions with students.