Choose-Your-Own-Grade
This section gives a brief overview of the literature and theory underlying CYOG. See the teaching narrative for my account of various ways in which I've implemented it.
Over the twenty-two years that I have been a teacher, I’ve grown increasingly uncomfortable with the task of assigning grades. This has led me to devote a great deal of time and energy to discovering a truly accurate, effective, and fair way to evaluate students in my courses. On my journey I’ve discovered so many problems with grades that it led me to take a radical departure from accepted practice in my Spring 2009 sections of ISAT 252, the introductory programming class in the BSISAT curriculum.
Statistical Arguments Against Using the Arithmetic Mean in Grading
Most syllabi contain some version of the following table:
| Assignment | Percentage |
|---|---|
| 2 Exams | 20% |
| 10 Labs | 40% |
| 2 Projects | 20% |
| Participation/Homework/Quizzes | 10% |
| Final Exam | 10% |
| Total | 100% |
The underlying formula used to calculate the final percentage looks like the following:
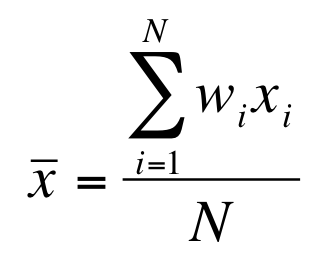
Where is the weight of each element to be averaged and is the score assigned to each element that goes into the average.
A basic premise of statistics is that in order to be valid, the data to which statistical procedures are applied must meet certain requirements. For calculating the arithmetic mean, one of these requirements is that the underlying data must be at least interval or ratio level. That means, that if x is a score that is measured on a scale of 0-100, that there is a fixed, meaningful distance between every level of the scale. In other words, the distance from a score of 10 to a score of 20, must be equal to the distance between 70 and 80. Measures of phenomena like age, temperature, and weight conform to this assumption, which means that we can talk meaningfully about the average age of our students, or the average temperature in September, or the average weight of Americans.
Unfortunately, on a typical test in a college course, or on most assignments, this assumption is not satisfied. If it were, then it would be meaningful to say that an 80 is twice as good as a 40 on a test. I doubt that many students or professors would agree with that statement. One of the reasons that this problem occurs is that the points on a test or assignment are not assigned based on any measurable underlying properties of the elements of that test. For example, when a typical instructor creates a test, he or she may decide that since four chapters were covered since the last test, that the current test will have four sections, each representing the content in one chapter, and accounting for 25% of the points to be assigned. While this sounds reasonable, it is difficult to make an argument from a measurement perspective that this is accurate. Why shouldn't section one be worth 30% and section two worth 20%? Why should true/false questions be only two points each, while the essay is worth ten points? Is the essay really “five times” as “important” or “valuable?”
This does NOT mean that individual questions are invalid or unreliable. If I ask a student to solve the problem 3 + 4 = ? I will very likely be able to determine that student’s ability to do single digit addition, but it does not translate into a scale made up of 50 or 100 such problems.
The most plausible argument is that scores on tests and assignments are ordinal measurements, i.e. it is reasonable to say that a person who scored an 80 on the test mastered more of the material than a person who scored a 40, but it is NOT reasonable to say that the person who scored 80 learned “twice as much” as the person who scored the 40. There are too many confounding variables to make such a claim.
What this means is that the arithmetic mean is NOT an available statistic when it comes to analyzing student performance. When statistics are applied improperly it doesn’t mean that the analysis is incorrect, but it means that there can be no reliably meaningful interpretation of the results. When a student gets a 40 or an 80 there are many plausible explanations for this, many of which may have little or nothing to do with the student’s underlying academic ability or level of mastery.
Despite the fact that many or most college professors have passed one or more statistics classes in the pursuit of their doctorates, this basic principle of statistics is almost universally ignored when grades are “calculated.” The next section will show further complications when these numbers are then converted into letter grades that get used to “calculate” a GPA.
GPA is NOT a Robust Measure
John Vickers, a member of the Philosophy Department at Claremont Graduate University, wrote a fascinating paper in which he demonstrated a number of structural problems with the calculation of GPA (Vickers, 2000). First, since GPA masks many of the properties of the courses incorporated into the calculation, it is not an adequate measure for comparison of students. For example, a student who takes ten easy courses shouldn’t be assessed in the same way as a student who takes ten very challenging courses, yet GPA masks this. As Vickers points out, “this has the undesirable effect of encouraging students to avoid difficult courses in favor of easy ones in the end of maximizing the GPA” (p142). Second, GPA is not sensitive to the number of courses a person has taken, so that it is possible, though not logical, to compare two students based on GPA, one of which as taken only a few courses, and one who has taken many. Likewise, students who seek to make the most of their college experience by taking as many courses as possible in a wide range of subject areas may find that their GPA suffers. So here we see that GPA has the effect of discouraging students to take challenging courses or to experiment with a broad range of subject areas.
More insidious than these effects, is an intrinsic property of GPAs: the mere fact that the method of their calculation is not standard across institutions means that any ranking of students based upon them is inherently unreliable. While I won’t go into the details of Vickers’ argument, he demonstrates that if two students John and Mary take the same three classes and receive the following grades A, A, F, and C, C, C respectively, depending on how the GPA is calculated sometimes John ranks higher than Mary, sometimes Mary ranks higher than John, and sometimes they are equal. It is logically inconsistent to stipulate that John is both better and worse than Mary, but that is an inescapable property of using GPA to compare them. Any professor who has ever altered the weighting scheme of grades in a course mid-semester (see the table in the previous section) is susceptible to inaccuracies of this nature.
This also means that any graduate programs or employers who sort and select students based on GPA are likely to be making errors in judgment, and possibly treating students unfairly. It should be noted, that this analysis assumes a perfect world in which every instructor is perfectly impartial and absolutely consistent in the manner and means of assigning a grade to each student. In practice, we know that this is not the case as the next section will describe.
Professors are Inconsistent in How They Assign Grades
Paul Diederich published a book in 1974 called Measuring Growth in English in which he related the results of an experiment that he conducted. Fifty-three college professors in six different fields were asked to read 300 student essays and assign each one a rating on a scale of 1-9, low to high. He found that 101 essays “received every grade from 1 to 9 [the entire range possible]; 94% received either seven, eight, or nine different grades” (p6). In short, there was very little agreement among college professors as to what constitutes a “high quality” essay. Their markings were inconsistent.
From personal experience, many of us know that even the same professor can be inconsistent in the assessment of student work. A professor’s perspective on quality is likely to change between reading the first essay and the last essay in a pile of essays. Some professors attempt to protect themselves from fatigue or bias by masking the names of the students when they are doing their grading, by making at least two passes through the papers, or other means of assuring fairness, but we don’t always have that much time and/or energy. And while few would argue that professors do not have the ability to make an expert judgment on the quality of student work, the means by which they do it breaks with the best practice of researchers doing qualitative analysis.
In any publishable scientific work in which qualitative expert judgments are used for analysis, researchers are careful to follow the rules for such methods. First of all, to be considered valid and reliable, any expert judging scenario must involve at least two judges, but typically involves three or more. The judges go through a process of standard-setting and calibration on some subset of the work that is to be judged. Some procedure for resolving disagreements or discrepancies in the judgments is established prior to the evaluations. And while we teach this methodology in qualitative research methods courses at every university, we seldom, if ever, follow these basic guidelines when evaluating student work.
Students are intuitively aware of the lack of consistency in how grades are assigned which is why many have given up on the effort to determine for themselves the quality of their own work. The uncertainty of how a particular professor will evaluate a particular piece of student work leads to a great deal of anxiety which is detrimental to the learning of students. The field of psychometrics is dedicated to eliminating such uncertainty in how academic ability is assessed.
What Psychometricians Do
Since there is no way to observe directly the academic ability of an individual on any given task, we use proxy tasks such as test questions, or essays or assignments to guess at what a student “really knows” or can do. The field of psychometrics aims to make these observations as scientific and reliable as possible. Classical test theory describes a property of test questions called “discrimination.” Using the classical definition, discrimination is the power of any given question to discriminate between test takers who have mastered a particular ability or not, and is defined by the following formula:
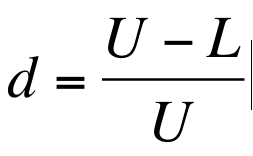
In which U is the number of test takers in the upper quartile who answered a given question correctly, and L is the number of test takers in the bottom quartile who answered that question correctly. Thus if the same number of high and low scorers got the question correct, the question would have a discrimination score of zero, whereas if all of the high scorers got it right and all of the low scorers got it wrong, the discrimination would be one. If more of the low scorers got it right than high scorers the discrimination would be negative and indicate a flawed or “trick” question. Some of the online learning management systems such as Blackboard will actually calculate a discrimination value for tests delivered online in this fashion.
The major problem with classical test theory is that in the given scenario, there is no way to separate the quality of a question from the set of test takers, or the set of questions with which it was assessed. For example, if the group of test takers is very uniform in their ability, then discrimination scores will tend to be very low. The same question will thus have a different discrimination score depending on who the test takers are, and what other questions are on the same test. In order to remove these deficiencies Item Response Theory (IRT) was developed.
IRT defines what is referred to as an Item Response Function (IRF). The most common IRF used in professional testing scenarios is the three-parameter model which is defined as follows:
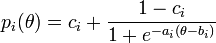
In which is the probability that a test taker with ability will respond correctly to a question i. The three parameters of the model are typically described as follows:
- a: discrimination parameter, defines the slope of the IRT curve
- b: difficulty parameter, defines left-right shift of the IRT curve
- c: guessing parameter, defines the y-intercept of the IRT curve
And when graphed, typical IRT curves look as follows:

Theta is the underlying ability that is being measured. A theta of zero indicates that a test-taker is of average ability and the x-axis measures standard deviations above or below the mean. The y-axis is the probability of a correct answer. In the figure above, the curves to the left are easier than those to the right, meaning test takers with a lower theta will have a higher probability of a correct answer. Steeper slopes indicate higher discrimination power. When there is a probability that the test taker can guess the correct answer, as with a multiple choice question, the curve will intersect the y-axis in a non-zero position.
Using IRT, psychometricians are able to determine the quality of a test question independent of the test takers and independent of the other questions on the test. However, there are some severe limitations. The three parameters must be estimated based on experimental data and cannot be known ahead of time. Typically some form of MLE (maximum-likelihood estimation) is employed for this purpose, but in order for MLE methods to yield reliable estimations of the parameters it is necessary to have 500-1000 responses to a given question. This is why professional testing agencies such at ETS always have an “experimental” section on tests such as the SAT. This is where they are gathering data on potential questions for future tests so that they can estimate item parameters.
Clearly such a level of rigor is not practical for classroom educators, nor is it necessary for professors to get a pretty good sense of how much their students have learned. The distinction I make here is between test questions used for assessing students’ understanding and test questions used for assigning grades. Test questions are wonderful for assessing understanding, but they are terrible for assigning grades because they do not have the reliability or accuracy of questions developed in a professional testing context. But even if we could achieve such rigor with our test questions, grades are troublesome for other reasons.
Grades Undermine Motivation to Learn
It is not in question that grades motivate students to study. However, what is important is not whether they motivate, but how they motivate. Motivation researchers distinguish between two types of motivation: intrinsic and extrinsic. People who are intrinsically motivated engage in a behavior for no other reason than the behavior is satisfying. They need no external goal or reward and would engage in this behavior anyway regardless of how others tried to influence them. Extrinsically motivated behavior, on the other hand, is engaged in for the sake of earning some form of reward, or avoiding some form of punishment. Rewards and punishments can be intangible, such as praise or derision, or they can be tangible such as gold stars, money, or grades. The effects of extrinsic rewards on learning have been studied extensively.
Deci, Ryan, and Koester (2001) published a meta-analysis of 101 studies that looked at the relationship between the use of extrinsic rewards (i.e. grades) and a free-choice behavioral measure of intrinsic motivation, i.e. students’ proclivity to engage in content-related academic activity because they chose to. Across all contingents, the tangible rewards had a large negative correlation (-0.34, p<0.05) with intrinsic motivation. In particular, performance-contingent rewards (“rewards given explicitly for doing well at a task or for performing up to a specified standard”, p11), harmed the motivation of students who received the maximal reward (i.e. A+) to the tune of -0.15 (p<0.05), and had a devastating impact (-0.88, p<0.05) on students who did not receive the maximal reward (i.e. < A+). That means, that as a result of receiving grades, even our best students have LESS desire to engage in content-related activities.
There is quite a bit more nuance in the discussion of intrinsic versus extrinsic motivation. For example, there are various kinds of extrinsic motivation, not all of which are harmful. Furthermore, there is a functional relevance in our society for having certain performance goals (i.e. goals focused on attaining some extrinsic reward) and being able to attain them. However, it is entirely possible to foster the kinds of performance-oriented behavior we need for students to exhibit without using grades and thereby avoid the risk of damage that grades bring.
Alfie Kohn in his extremely well-researched 1993 book Punished By Rewards explains several other good reasons to avoid the use of extrinsic motivators in the classroom, namely:
- Grades Punish
The very act of distributing grades to a class means that you create “winners” and “losers” which creates a sense of anxiety in the classroom which is not supportive to learning. - Grades Rupture Relationships
Students perceive the use of grades by an instructor as controlling, i.e. the instructor is trying to control their behavior. Humans, at least Westerners, almost universally seek autonomy, and reject being controlled by others. The use of grades highlights the power disparity between students and professors. It frequently stands in the way of open, honest and trusting communication between students and professors. It can lead to things like students hiding their lack of understanding for fear that the professor will develop an impression of them as “stupid” or unable to learn. - Grades Ignore Reasons
When I was still an inexperienced instructor I used to establish strict policies for things like attendance, due dates, grading standards and the like. I discovered in time that this was one way I protected myself from having to get to know anything about my students. If you missed class, I didn’t have to know anything about the reason because I had a policy to cover the consequences of that event. While this may be expedient for professors, I found that it was detrimental to creating a supportive and positive learning environment. - Grades Discourage Risk-Taking
“Is this going to be on the test?” is one of those questions at which professors cringe when they hear it. Research has demonstrated that when students are overly focused on the grades the quality of their work, the creativity of their solutions, and their ability to see globally suffers. They focus solely on trying to produce what the professor wants. This is what Ken Bain refers to as “strategic learning” and it results in the production of what he calls “rote experts,” or people who can provide the textbook answer to any problem scenario, but can’t think outside the box. What we really want, he says, are “adaptive experts” and grades interfere with their creation.
If the goal of our efforts as educators is to create enthusiastic life-long learners and problem-solvers, these are critical considerations that we must acknowledge. More recently I’ve uncovered some other lines of research that bring the use of grades into question.
Brain Research and Positive Psychology
I recently attended a talk by Dr. Barbara Fredrickson, author of the book Positivity in which she recounts her research that indicates that “experiencing positive emotions in a 3-to-1 ratio with negative ones leads people to a tipping point beyond which they naturally become more resilient to adversity and effortlessly achieve what they once could only imagine” (from the book jacket). She cited her research which has found that positive emotion expands awareness, allowing people to see global patterns instead of discrete facts, fosters better memory for detail, engenders the ability to see more possibilities, to be more creative, to have higher performance, be more resilient, and to have a greater capacity for empathy.
If grades can stimulate fear and anxiety in students, I hypothesize that the practice may inhibit some or all of the benefits of positive emotion that Fredrickson discusses. On the other hand, her research suggests that adversity in a 1-to-3 ratio to positivity is necessary for a person to thrive. It will be interesting to try to discover how to use grades effectively in this framework. Regardless, there is a broad literature on the neurological impacts of stress on cognition and learning that support the notion that stress induced by grades may be detrimental to learning.
The History of Grades
The last facet of my search that I’ll share here is my investigation into the history of grades. Grades are such a fact-of-life in today’s schools that it seems that they must have always existed. Quite to the contrary, grades, as currently used, didn’t gain widespread acceptance and use until the 19th century. Reading accounts of the epistemological discussions of academics from the 17th to the 19th century in the US reveals that they wrestled with many of the same issues that I have brought up here. It is easy for us to accept the current practice with a blind faith that since everybody uses grades, their validity and worth must have been proven at some point in our past. I wanted to believe that someone somewhere had done the due diligence to establish grades as an effective and worthwhile practice in education. As it turns out, it has never been done. For excellent accounts I refer you to Mary Lovett Smallwood’s (1935) An Historical Study of Examinations and Grading Systems in Early American Universities, Laska and Juarez’ (1991) Grading and Marking in American Schools: Two Centuries of Debate, Finkelstein’s (1913) The Marking System in Theory and Practice, or the short, amusing and accessible address by Louise Witmer Cureton (1959) "The History of Grading Practices."
Summary
Taken all together, I believe the above constitutes a fairly robust argument for abandoning grades as a tool of teaching. The problem, of course, is that the practice of using grades is deeply embedded in our society, it is difficult for people to conceive of alternatives. I have worked for years in attempt to come up with viable alternatives, and have met with some successes, but overall, not as much as I would have liked. I am very grateful to be in a department like ISAT at a school like JMU where such explorations are not only possible, but lauded and encouraged!