Custom Courseware
It's very difficult to describe software with words and pictures. I've created a video of some of my work that you can watch on YouTube:
When it comes to educational technology, my guiding metaphor is:
To keep my finger on the pulse of the class.
Different students have different needs. My goal as an instructor is to be able to make every student feel like they're getting one-on-one attention.
I have spent a great deal of time writing software to achieve this goal. On this page I'll describe some of the features that I think are significant.
Personal Profiles
Each student in my class has a personal profile page that has their photo, contact information, and also information about their progress in the course:

Students were in control of what contact information they shared with the class, and the profile pages are only available to class members who have logged into the course website. One of my explicit goals has always been to foster connections between members of the learning community.
Have I Read This?
On all of the important pages on the site, in the upper-righthand corner of the page is a button that gives students the opportunity to convey to the instructor and other classmates that they have, in fact, read a particular page:

After clicking the button, the interface changes to display a "Thank you!" In addition, by clicking the "Show Readers" link, a list of everyone in the course who has (and has not) read the page is displayed:

This is a subtle bit of peer pressure designed to foster a desire to be part of the "cool kids" club (who has read the content on the website).
This widget also serves as insurance for the instructor so that if a student doesn't meet expectations, they can't claim not to have read the course content.
On each person's profile page is a list of all of the pages they have read:

There is also a list of "Pages I Haven't Read" which gives the instructor a quick way to see the list of either:
- People who haven't read a particular page
- All of the pages a particular person hasn't read
On the instructor dashboard, there is also a list which shows which students are delinquent in their reading. This is one of the clues that I use as instructor to know when a student is falling behind and may need some additional attention from me.

Again, the goal is not to play "gotcha," but rather to have an "early warning system" that will help me prevent students from falling through the cracks.
Do I Want To Learn This?
Another feature of my courseware is a widget that allows students to express interest in learning a particular topic, and also to see all of the other students who also have expressed an interest in that topic:

Once a student has adopted an objective, the button turns into a progress bar that the student can then update as they reach various stages of learning for that topic:

There are five levels of learning with a common interpretation:
- I haven't started learning this yet
- I have followed a basic tutorial or read some basic information
- I have used the information from the reading or tutorial to produce a **new** artifact
- I have gotten feedback on my artifact from other students, and I have given feedback to them on their artifacts
- I have taught someone how to do this thing, or created a tutorial of my own for others to follow
When the student gets ready to attempt the get/give feedback step, they can find other students who are at the same level as them by clicking the "Show Adopters" link that displays a list of everyone who has expressed an interest in this objective and what their current status us.
For evaluation and self-monitoring each student can list all of the objectives that they have and have not adopted on their own profile pages and can update their progress there as well:

Since there are many more objectives available on the site than there is time to accomplish all of them in a semester, students have the ability to:
- customize the course to the set of skills that interests them,
- manage and monitor their own progress as they work towards those goals
- identify other students with similar interests and work with them to reach their goals
It also gives the instructor the ability to identify students who might be good candidates to provide assistance to other students, or conversely, to find out which students are struggling and need more help.
Weekly Self-Evaluation
Another feature of my courseware is the weekly self-evaluation module. The idea is relatively simple. Each week, each student receives a customized questionnaire that takes on the order of 5-10 minutes to fill out. The responses on the survey are displayed on the student's profile on the website, and are also used to customize the next week's survey. This level of customization is only possible using the Qualtrics API which I convinced JMU to purchase access to. Here's how it works. Each week, the student is asked what goals they have for the upcoming week, and also how many hours they plan to spend on the class outside of our regular meetings:

This data is stored in the Qualtrics database and can be used to populate fields on the next week's survey asking them if they actually accomplished those goals:

Remember, these surveys are CUSTOMIZED to each individual student, so even if there are 100 students or more, it is as if the instructor developed a personal questionnaire for them each week.
In addition, the students are asked to indicate whether or not they have any artifacts to prove that they have completed the goal. This gets them in the habit of always considering what kind of evidence indicates accomplishment. The results of these surveys are displayed on their profile pages on the website:

Notice that some of the goals are course-related and others are not. When I first devised this system I was very surprised that students included "irrelevant" goals, but then I realized two things:
- It gives students an opportunity to think about their life more broadly than just this class
- It allows me to learn more about them and their lives
I did recommend that about 60-80% of the goals should pertain to the class. I also encouraged them to set goals that could not be accomplished in a single week to foster longer-term planning. I also gave them feedback on whether or not goals were measurable and attainable. The icons on the image indicate if the goal was finished (the check mark) and whether or not there was evidence (the little notebook).
Another piece of the weekly self-evaluation was to ask students to set a target amount of time to study, and then to report on that. This was prompted by research which indicates that the only reliable measure that predicts learning is time-on-task. I asked students to set a target goal of spending an hour per day outside of class. I generated personalized data visualizations to help them see their own progress relative to their own goals and compared to the rest of the class:

In this chart:
- The red horizontal line represents the seven hours per week that the instructor recommends everyone spend
- The purple line is the number of hours the student planned to spend each week
- The green line is the number of hours the student actually spent each week
- The blue box plots represent the amount of time that the class said they planned to spend each week
- The orange box plots represent the amount of time the class said they actually spent each week
So in the chart above, the green line is above the purple line until week 8. This means the student usually spent more time than he planned, though not by much. Both the green and purple lines start below the red line, then track it, then go above it showing a gradual increase in the amount of time spent relative the the instructor's recommended seven hours. Finally, comparing the student's data to the box plots, the student's planned and actual time spent typically stayed above the 75th percentile for the class, although he could see that there were some people spending way more time than him.
Again, these charts were automatically generated based on the responses students gave to the weekly self-evaluation surveys. Here is a screenshot of part of the interface that the instructor uses to set up the weekly self-eval surveys:

The instructor enters their Qualtrics credentials, sets the start and end dates for the semester, selects all of the dates on the calendar that they want the survey to go out (all Fridays except Thanksgiving in this picture), selects the survey (which must be separately created in Qualtrics), and also the emails used to invite and remind students to take the survey.
Customized emails came out with a personalized survey link sent to each student, and up to three reminders were sent to students on subsequent days to only those students who had not completed the survey already. This way it was possible to get roughly an 80% response rate (or better) most weeks. After a number of semesters, I realized that it was unrealistic to expect that every student would be on the ball enough to respond every week, but by the same token, I was able to quickly identify which students were falling behind.
The upshot of all of this was that I was able to collect a VERY large amount of near real-time data about all of my students every semester. It allowed me to figure out who was keeping on the ball, and who was not.
The Badge System
More recently, I've switched to the badge system. Now the profile page contains a list of all of the badges a student has earned, and their current point total towards earning their target grade that semester. Here's an example of what it looks like:

In addition to the "Badges Earned" section, there is a "Badges Still Available" section that displays the entire array of badges that a student can still work on:

Upon clicking on any particular badge, the student gets a full description of the badge, along with detailed instructions about how to earn it:

And also a listing of profile pictures (linking to the profiles of classmates) of people who have and have not already earned the badge:

This can be used either to find people with whom to work on a particular badge, or from whom to get help or advice on completing the badge.
The new profile pages also contain a personalized, constantly updating graph showing the points earned to date and the student's trajectory through the course:

Above is a student who appears to be on an "A+" trajectory still in the 4th week of the course. Below is a graph that shows a student who completed the semester well, but who didn't do a lot towards the middle and had to scramble to earn enough points to pass towards the end:
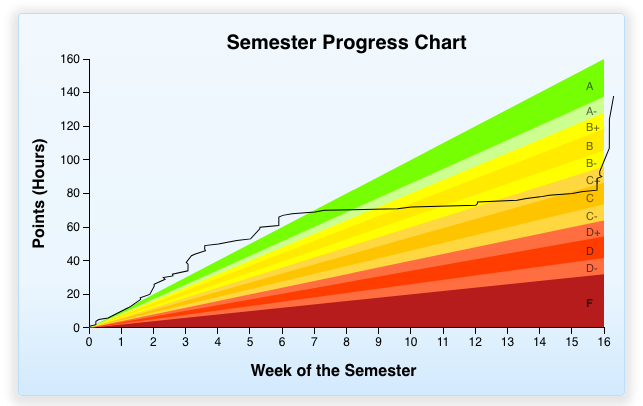
Not only do these graphics inform students, but they also inspire them to learn how to write the code to generate them. Both are built using an open-source JavaScript data visualization library called D3.
Other Online Materials
In addition to writing and testing software to test pedagogical innovations, I have generated a significant amount of online content. Videos on my YouTube channel have collectively received over 90,000 views, with the most popular video having over 25,000 views.

I've also got a growing number of online slide decks, and there are the two places that I blog most frequently:
Thank you for examining the software that I've built and use for teaching.